
Replacing Excel with SQL, a Web Frontend, and AI Agents
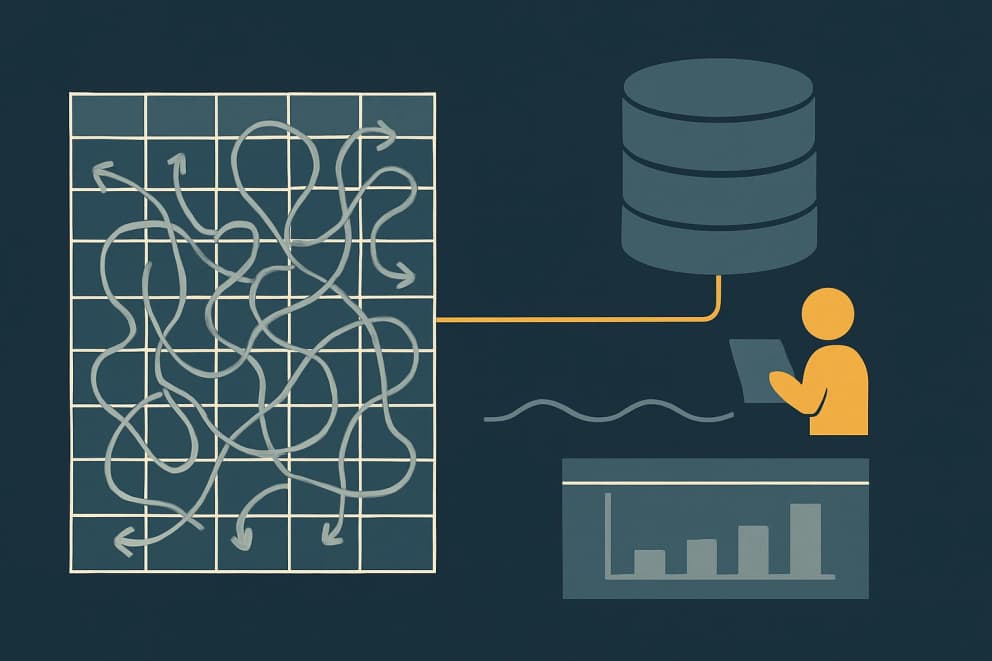
The monthly report is built in the same workbook again. Someone pastes in two system exports, extends the VLOOKUP columns, refreshes the pivot table, and sends the file as an attachment. This month one cell shows #N/A, and nobody can say since when.
Anyone who recognizes this scene is not working with a spreadsheet but with four tools in one file: database, data preparation, report layout, and calculation engine. That overloading is the source of most spreadsheet pain. Each of the four roles has a better home elsewhere, but as long as everything lives in one file, all roles share the same cells, the same file on the network drive, and the same silent failure mode.
We saw what this feels like at MAFU-SHERPA. The postings for the monthly close sat in Business Central, but the way into DATEV ran through manual Excel preparation that was error-prone and hard to check properly. The automated DATEV export replaced that preparation with a small application; the case accompanies us through this article.
Which roles SQL, a web frontend, and agents take over
The first role is storage. A SQL database such as Postgres or DuckDB enforces what a column may contain; SQLite does so once tables are declared STRICT. A date stays a date, an amount stays a number, and a typo lands on the table as an error message instead of as a silent text value in row 3,412. Row counts also stop mattering; whether a dataset holds 500 or 5 million rows changes nothing about the query, while Excel simply ends at 1,048,576 rows.
Lookups become joins instead of VLOOKUP chains. A VLOOKUP points at cell ranges, and once someone inserts a column it silently returns values from the wrong column. A join connects records through a key and stays stable regardless of how the table happens to be sorted. The query for revenue per customer fits in one line, namely SELECT customer, SUM(amount) FROM invoices GROUP BY customer.
The second role is preparation. Aggregations, clean-ups, and conversions move into SQL views or a thin scripting layer. The logic then exists as text and can be versioned and tested. In the DATEV export, the rules, such as the debit and credit marker derived from the sign and amounts written with the German decimal comma, live once in the application code instead of being applied by hand every month.
The third role, the report, goes to a small HTML page with a charting library, which turns the same query into the same report every month, reachable at a URL instead of as an attachment in twelve inboxes. Anyone opening the report sees the current state.
The fourth role, orchestration, is newly assigned, because AI agents can run queries, refresh reports, and flag anomalies, for example a supplier missing this month or a total that has turned negative. For ad hoc questions, the agent writes the query and the database supplies the answer.
This division carries the most weight for four kinds of spreadsheet work:
- Recurring reports that follow the same pattern every month.
- Reconciliations across several sources, such as ERP against bank or shop against accounting.
- Anything above a few thousand rows.
- Files that several people maintain at the same time.
Where Excel still wins
In fairness, Excel continues to win a whole class of work. For the one-off analysis of a CSV export, an hour of clicking is cheaper than an evening of code. Nobody needs a database to sort, filter, and annotate a price list once.
Excel also remains the right surface when colleagues outside IT maintain inputs themselves. The cell grid is a user interface nobody has to explain; a planning sheet that sales fills in monthly is better off there than behind an input form somebody first has to build and maintain.
Highly interconnected what-if models are a third case. A financial model in which a changed assumption immediately recalculates through every scenario lives on exactly the cell network that gets in the way of reporting; rebuilding it as software usually costs more than it returns.
And sometimes Excel is simply the expected format. Tax advisors, auditors, and banks accept workbooks, not database dumps. When a spreadsheet is fundamentally enough, and when it turns into the unofficial system, is covered in our guide Custom Software vs. Off-the-Shelf.
Why agents edit code better than workbooks
The strongest reason for the move is still to come, and it concerns automation. If AI agents are supposed to take over part of the work, the form the logic lives in decides the outcome, because agents edit text far more reliably than cell graphs.
A SQL file is a linear text document an agent can read in full. A workbook, by contrast, is a graph of cells with implicit dependencies, which the agent sees only through the lens of a library that serializes the file. A change to a formula in code is local and bounded, while a changed cell silently alters dozens of dependent cells. The feedback loop is unequal as well. A query can be executed, and the error message appears seconds later; recalculating a workbook outside Excel takes an approximating calculation engine that can diverge from the original on dates stored as serial numbers, on rounding, array formulas, and volatile functions. Then there is review. Text diffs can be read line by line in version control, while a binary .xlsx comparison cannot. And SQL has a grammar and a type system, while Excel formulas rely on implicit conversions the agent has to guess.
To keep the picture fair, the other side belongs here as well, and it comes from our own agent work as of August 2026. Reading values, writing flat tables, formatting cells, and generating fresh workbooks is reliable there. It gets brittle when agents edit existing formulas, pivot tables, charts bound to ranges, named ranges, conditional formatting, and macros.
The file still opens afterwards.
That is precisely the quiet failure mode. The numbers are wrong, nothing warns, and it surfaces only when somebody recalculates or the report is already with a customer.
Agents that operate inside the live Excel application, such as Copilot directly in Excel, narrow this gap, because Excel itself then does the calculating. They only partly solve the review problem, because Excel's change history records cell and formula edits with their previous values, but does not fully track pivot tables, charts, and formatting, and does not produce a version-controlled diff of the whole workbook. Whether better tooling changes that fundamentally remains open.
What to settle before committing
The move does not run itself. Seven points decide whether the idea becomes a dependable workflow.
- Data ingress: as long as colleagues keep typing into Excel, you have added a pipeline and removed none. Define which system holds the truth.
- Schema discipline: a properly defined SQL column does not tolerate a mix of dates, blank cells, and 'TBD'. Budget time for cleaning and decide what an empty value (NULL) is supposed to mean.
- Ownership: database, frontend, and agent need someone who can investigate all three layers when something fails.
- Agent guardrails: the agent gets read-only credentials and works on tested views rather than the raw data; before a number flows into a decision, a person checks it. Treat agent output like a junior analyst's draft.
- Security and operations: a file becomes a service. Authentication, backups, and hosting are your concern from then on.
- Versioning: SQL and frontend live in git, and every report can be regenerated from the raw data. This is the single biggest win of the move.
- Migration: do not rewrite everything. Take the one painful, recurring workbook, rebuild it end to end, and keep Excel as an export format.
An eighth point from our own experience completes the list. Business users accept numbers from SQL only once they can check their plausibility without knowing SQL. In the DATEV export, the application therefore shows a data preview with validation notes before the import, so the check happens in the format the accounting team already knows. Build such checks in from the start, for example row counts per source and a reconciliation against a monthly total the recipients already trust. A report that ships its own control figures turns blind trust into a short, concrete check.
The stronger form of this rule is a second, independent computation path: an agent recomputes the query's result directly from the raw data without seeing the query. Checking this exhaustively was always possible and never economical until now; agents make it cheap enough to run after every change instead of only at acceptance.
A pragmatic reference architecture
For most cases, a deliberately small setup is enough. DuckDB or Postgres stores the data, SQL views, versioned and tested queries in the style of tools such as dbt, handle the preparation, a small static HTML page or a lightweight server shows the reports, and an agent with read access to the views answers questions and drafts summaries. More infrastructure, say a BI product or an orchestration platform, may come later once the need is proven. How such a rebuild fits into the rest of the process landscape is described in our guide to automating business processes.
The decision rule
The rule we apply ourselves is short. If agents or automation will do a meaningful share of the editing, the logic belongs in SQL and the presentation in HTML, and Excel stays at the edges as an import and export format in which nobody touches a formula. If the work stays one-off, interactive, or in the hands of colleagues outside IT, Excel remains the right choice and not a stopgap.
Can I use Excel as a database?
Yes, for small, non-critical datasets with few people involved, Excel works as simple data storage. The limits appear with concurrent editing, links across several sources, and growing row counts, at the latest at the row limit of 1,048,576. Once several people maintain the data, reports recur, or agents are meant to help, a SQL database is the more dependable foundation.
Which is better, Excel or a database?
It depends on the role. For one-off analysis, input by colleagues outside IT, and interconnected what-if models, Excel is better. For durable storage, recurring reports, and reconciliations across several sources, a database is better, because it can enforce data types and the logic exists as reviewable text.
How do I convert an Excel spreadsheet into a database?
Import the sheet as flat data, for example via CSV import into SQLite, DuckDB, or Postgres. Give every column a type (in SQLite via a STRICT table), name a key, and clean mixed values before the import. Afterwards, build calculations and lookups as SQL views on the imported data; Excel can remain as an export format where needed.
The one painful, recurring workbook from point seven is the right place to start, so let us discuss a concrete workflow.