
How AI Makes Complex Forecasts Reliable
In a rolling cash-flow forecast from one of our client projects, a formula counted a revenue line twice for months. Every month, that line entered planned receipts at twice its value. The model ran in Excel on the ERP system's data, received regular maintenance, and kept producing plausible totals. This account comes from our own delivery work. To preserve anonymity, financial magnitudes appear only as rounded percentages.
The error stayed unnoticed until the independent check.
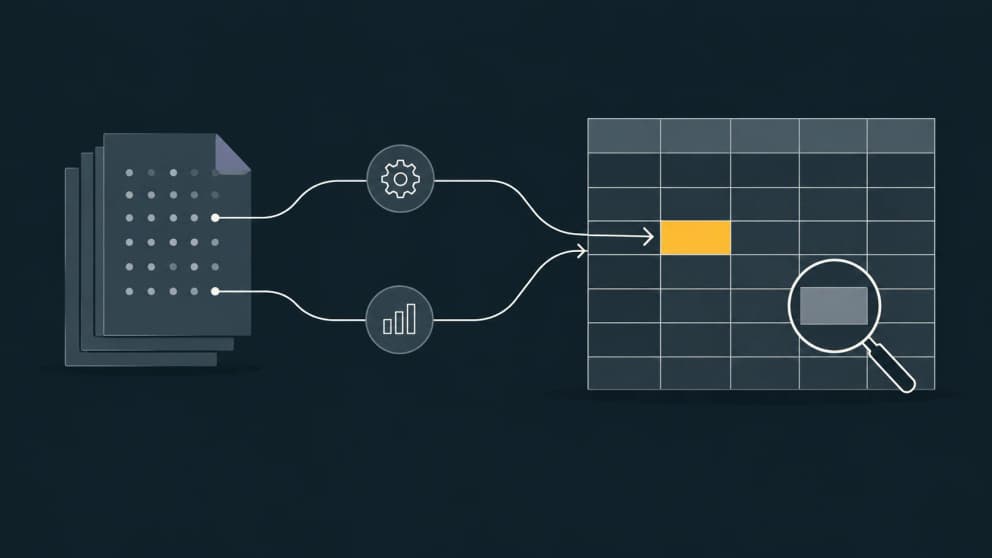
An AI agent then recalculated the planning chain from raw data outside Excel and compared it with the report. The same review found two further errors in the existing model. It also caught an error in the agent's own new calculation before that calculation reached the report. This case shows why plausible forecasts still need a check of how their numbers were calculated.
Why silent forecast errors survive
A forecast describes the future, so its assumptions cannot yet be compared with the final outcome. Its arithmetic, however, can be checked today. In this project, regular use had not exposed a duplicated revenue line. The people reading the report saw results rather than calculations. Meanwhile, the model's author knew what each formula was intended to do. That familiarity made the output look credible. Repeating the monthly run therefore did not establish that the calculation was right.
One cell in the model illustrates the problem. Actuals, rolling averages and individual plans lived on separate sheets. An IFERROR/INDEX-MATCH formula selected a value for each account and month. It used the individual plan when that value was greater than zero; otherwise it fell back to the average. The full formula and an illustrative SQL comparison appear in when an Excel spreadsheet becomes software.
That distinction matters: a zero or negative plan was not treated as an override by this formula. The business rule must therefore be checked as well as the calculation.
Alongside the duplicated revenue line, the forecast contained two other existing errors. Three product lines contributed their full revenue but no direct costs. Nine account identifiers were stored as text on a planning sheet, while the lookup expected numbers. MATCH failed to find them, and IFERROR silently selected the fallback value. The individual plans were bypassed while averages appeared in the forecast.
The agent nearly introduced another error while building a rolling 12-month average from the general ledger. Its first attempt returned only about 2.5% of the actual value. Year-end entries that reset profit-and-loss accounts in the chart of accounts had effectively erased a year from the calculation. The independent check exposed the discrepancy immediately. The same verification rule applied to the agent's own work.
None of these errors produced an Excel error message.
What the independent calculation changed
In this project, the useful contribution was the second calculation from raw data. Formula generation was part of the work, but the first generated average was itself wrong. Trust came from investigating the disagreement between two calculation paths.
On one day, the agent recalculated 236 pivot cells in Python directly from the ERP interface and compared the results to the cent. On another, it checked every monthly column along the planning chain, from accounts and rolling averages through individual planning to the final report. That second check exposed the account identifiers stored as text. One checked month differed by roughly 8%, and that difference required an explanation. Simply reading the nine cells had not revealed it.
Since this forecast, a number counts as checked in our work only when two independent calculations agree and the underlying business rule has been confirmed. The comparison of 236 cells demonstrates how an agent can take on repetitive verification. Agreement alone would be weaker evidence if both calculations copied the same mistaken formula. We therefore derived the second result from raw data outside the workbook. The approach can be repeated after a change. Whether the assumptions about future receipts are sensible remains a separate business judgment.
The agent also controlled Excel through COM automation and created queries and DAX measures through scripts. On the ERP side, the work included dedicated query interfaces and server-side filters. The filters removed 20,000 irrelevant rows before the data reached the workbook, and the file became about 40% smaller. Every ERP-side change was checked in a test environment first, so a faulty query would have surfaced there rather than in the live system. All changes were also checked against the source data before being accepted into the reviewed workbook.
Where automation stops
The client continues to make the individual plans. Averages provide proposed values, while the account-level rules decide where an individual plan takes precedence. We would keep that division: an agent can calculate and check the model, while the person responsible owns its business assumptions. The positive-value condition in the formula is a good example of a rule that needs that person's judgment.
The delivered workbook supports refresh with the client's own ERP access. Its calculations are documented and repeatable. Our delivery record distinguishes the checked files from the client's live budget in the shared file store: adoption of the corrections there was still unconfirmed at the last recorded check. A verified file is not evidence that every operational copy has been replaced.
Five questions for your own forecast
You can discuss these questions without choosing a new tool:
- Has a report value ever been recalculated independently from raw data outside the model?
- Can someone trace any chosen report cell back to its source data?
- How do year-end closing entries affect averages and comparisons?
- Would a failed lookup, such as text compared with a number, become visible?
- Can you repeat a model change and identify which workbook version is in use?
Start with one important report value. Recalculate it through a separate path and investigate any difference before extending the check. In this project, the roughly 8% discrepancy exposed nine account identifiers that bypassed the individual plans. That is a concrete reason to check the calculation even when the total looks plausible. Book an intro call.